.png)
Scope and Purpose
The purpose of this document is to provide the user with an understanding of how to use GL based templates.
The scope of this document extends across the options available to generate the reports.
Highlights
Authorized users can create organization-specific templates for balance sheets, income statements and supporting schedules that contain firm-defined financial groupings relevant to the firms. Each of these financial groupings can contain one or more GL accounts.
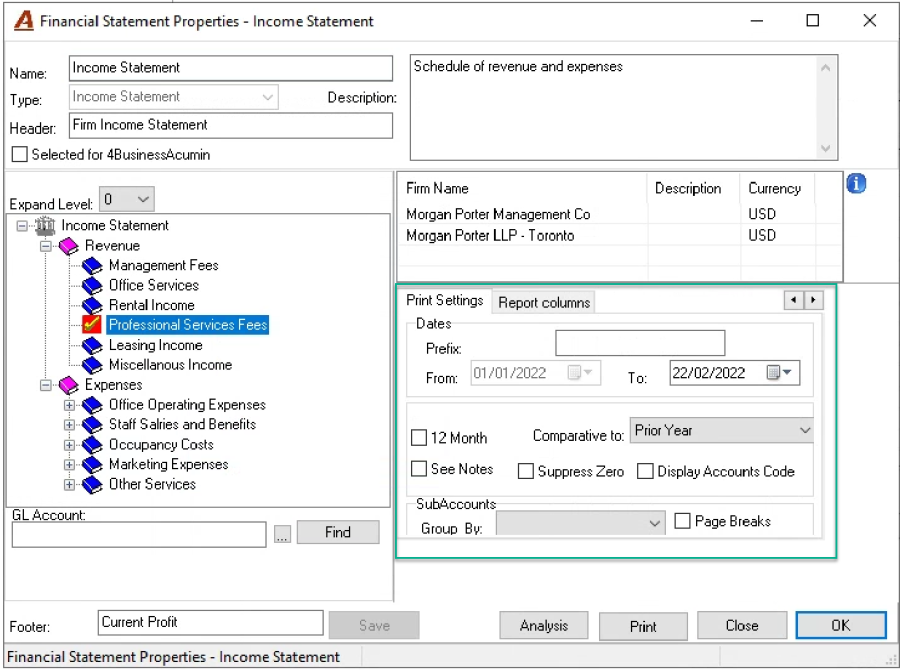
Highlight the statement and double click to access its filter and print options
The financial statement groupings can be created with multiple levels for users to have greater flexibility with presentation options. The multiple grouping-levels allow the user to present the statement or schedule fully or partially summarized by contracting or expanding the branches.
Expand the statement using the "Expand level" option. 0 means fully contracted and 4 means fully expanded. Users can also expand branches to desired levels by clicking on the plus sign.
Use the right click contextual menu of the nodes to further expand the level of detail by displaying the GL Account balances for a specific node-selections.
To find which grouping a GL account was assigned to, enter the GL account in the GL account field bottom left of the template form and press find.
Right-click on firms to add or remove to get the right combination of results
Add financial notes to selected groups. Highlight the node, and right-click to select "properties". Once in properties add the note to the note tab.
Complete your print settings. Select the "to date" for the report, the type of comparative or a monthly actual presentation. Select the report columns.
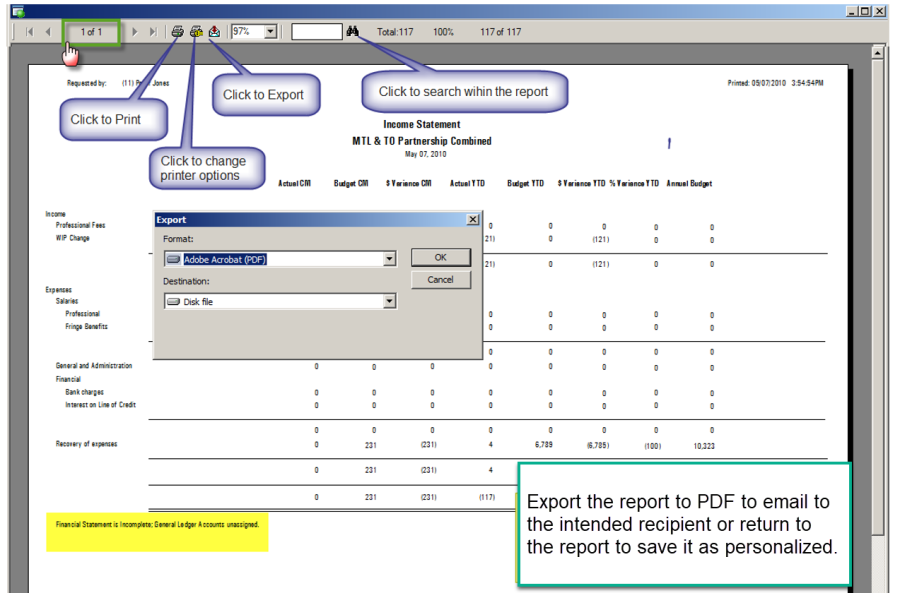
Press "Print" to generate the report in print preview, and generate on PDF to email, paper or export to excel.
The analysis report found – bottom of the template form - generates a trial balance type report that shows the GL account code and name grouped within the financial statement node for the report. It will report for all measures for all firms assigned to the format itself.
Use of Templates
Access
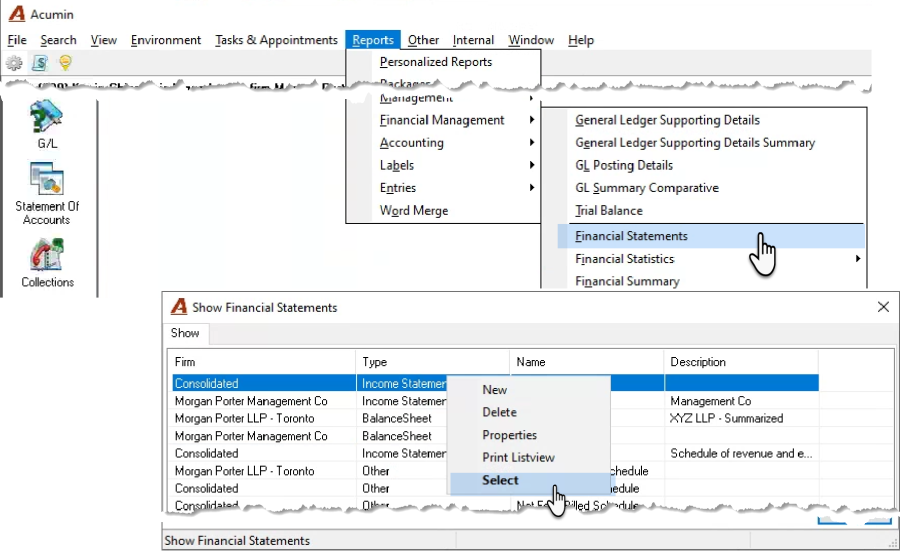
From the main menu select Reports – Financial Management – Financial Statements to launch the "Show Financial Statements" List view. Right-click and select or double click to launch the report's properties and filter form.
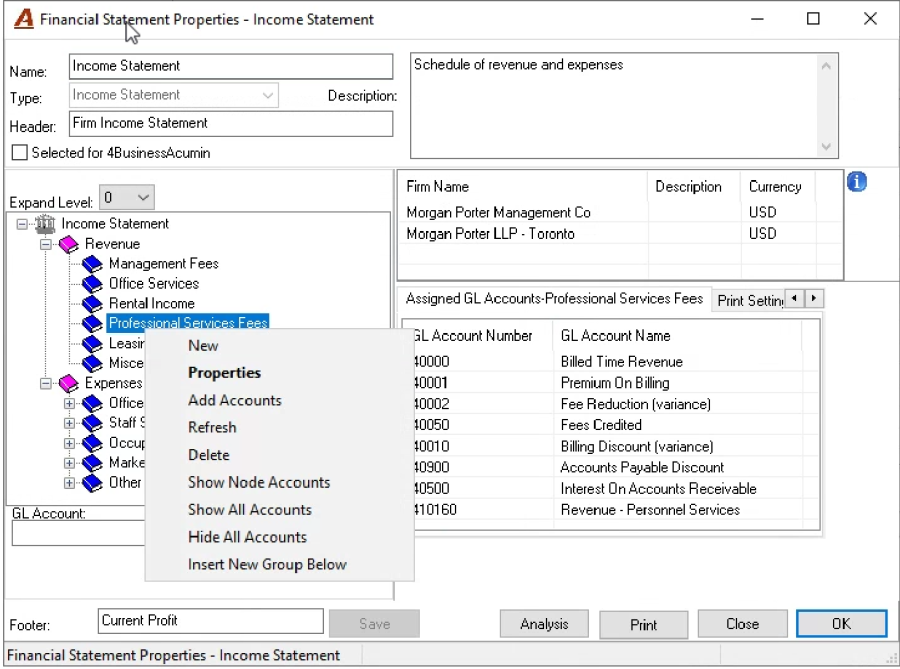
Right Click Contextual Menu Options
-
New: To create a new grouping;
-
Properties: Opens the properties of the highlighted grouping;
-
Add Accounts: Launches the GL account filter so the user can add another account to the grouping;
-
Refresh: Refreshes the tree;
-
Delete: Deletes the grouping. Only available if the highlighted group is the lowest level branch;
-
Show Node Accounts: Will add a checkmark to the group and on print the GL accounts assigned to the group will show as a further breakdown of the group with respective balances;
-
Show All Accounts: Same as above except all the groups are affected;
-
Hide All Accounts: Removes the checkmark from all groupings set to "Show Accounts";
-
Insert New Group Below: Allows the user to add a new financial statement grouping in a specific location.
Expand or contract the nodes on the tree view of groupings to add or remove detail to you report presentation. Also consider removing or adding firms depending on the level of consolidation needed.
Print Settings
Select the date range. The "to-date" selection will automatically set the from date. It is possible to back date the statement or schedule to any date.
Suppress Zero: click on this checkbox to suppress lines where all columns have a value of zero.
Display Accounts Code: if the user opts to print the GL accounts below the financial statement grouping, these can include the GL Account code if this checkbox is check-marked. Note: this option works in conjunction with the "Show Node account" options.
Select see notes, to include any new notes associated to any of the groups on the report.
The 12-months option and selection of comparative values will impact the options presented in the report columns sub-tab.
Use of Forced Sub-Account Logic:
Firms working with forced subaccount logic can create financial schedules which can be generated by sub-account logic (pivot to report by member or practice groups) which can also include page breaks.
Report Columns Options
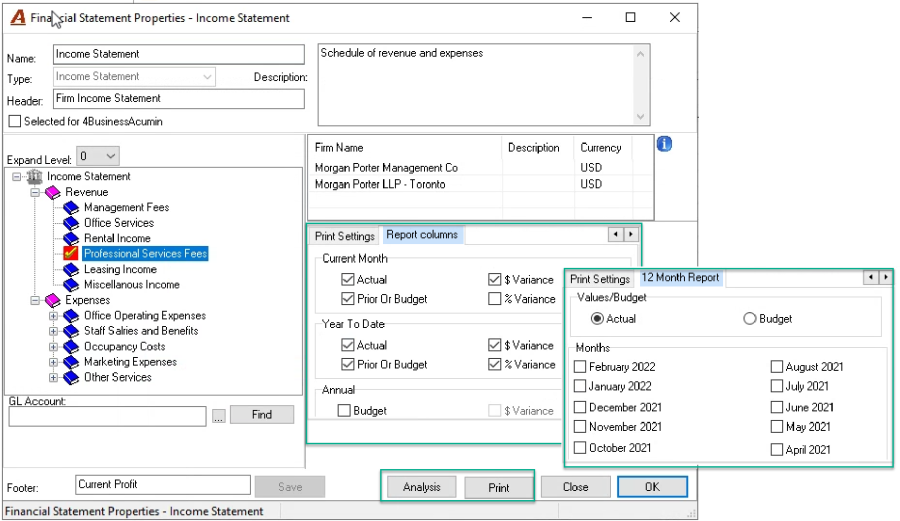
The "Report Columns" tab will present different options dependant on the selection of a 12-month report and/or comparatives to prior year, budget and/or both. In some cases, the report is restricted to several columns for portrait presentation whereas in others the information will be presented in landscape format.
Select budget and 12 months to see the monthly budget breakdown, every other option will provide the monthly actuals for the year selected.
Compare to budget or prior year to see the actuals and comparative for the last month in the date range a well as the year-to-date totals.
Compare to budget and prior year to get more comparatives. In this case only year-to-date measures are included.
Generate the Report
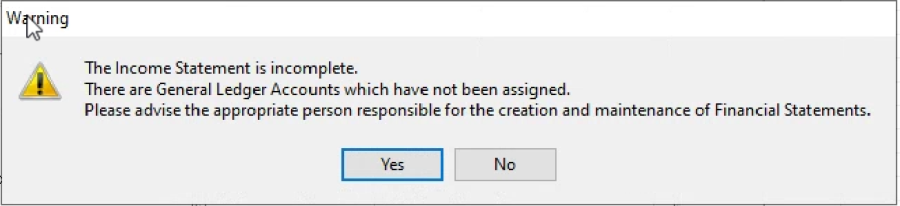
Once all the selections are complete, print to preview the report results. If the below message is launched, it means that there are unaccounted GL accounts in a controlled report (Income statement or balance sheet). Missing GL accounts should be added to the corresponding grouping.